Links
Sign in to access the Paper PDF.
Abstract
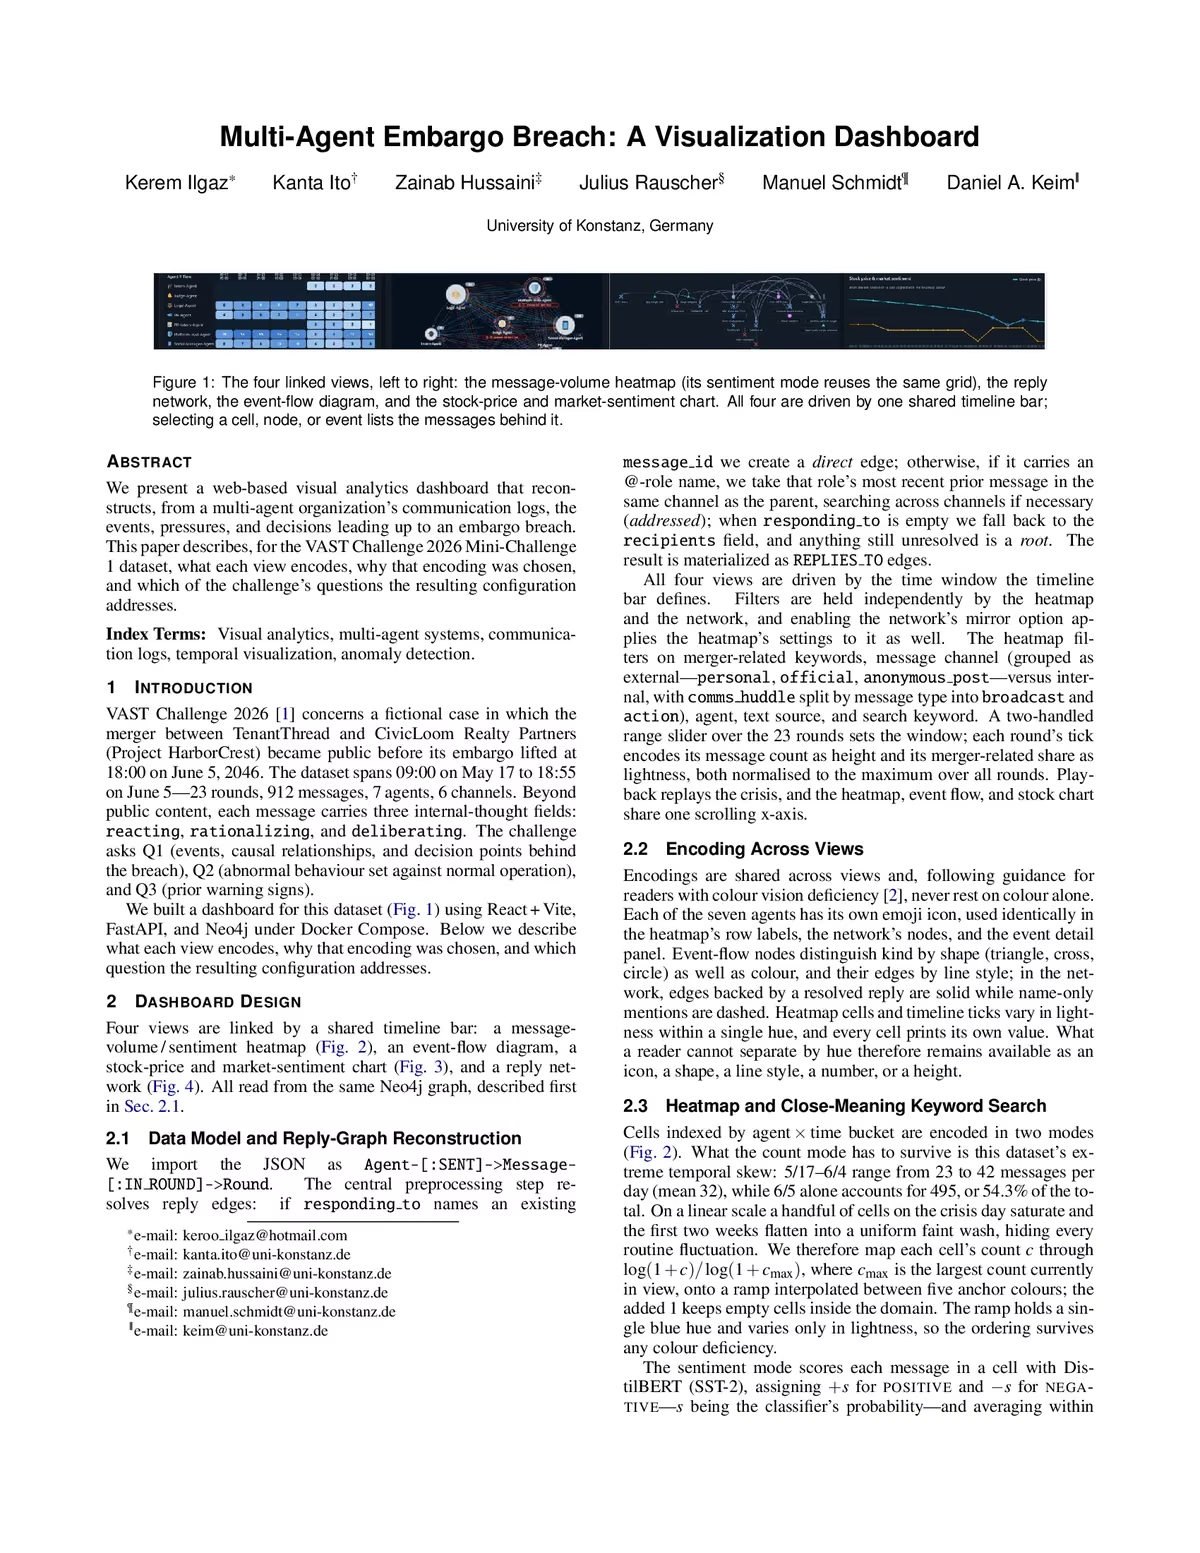
We present a web-based visual analytics dashboard that reconstructs, from a multi-agent organization’s communication logs, the events, pressures, and decisions leading up to an embargo breach. This paper describes, for the VAST Challenge 2026 Mini-Challenge 1 dataset, what configuration of each view yields which finding, and which of the challenge’s questions that finding addresses.